
Recognizing the harm of Air Pollution
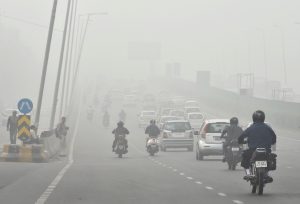
Air pollution is the leading cause of mortality and disability in India. The problem has been compounded by household and ambient air pollution, caused by factors such as burning of biomass fuel
By Dr Suneela Garg/ Dr Ruchir Rustagi


Among the huge spectrum of air pollutants, there are certain air pollutants, which are regarded as most harmful to health. They include, particulate matter (PM 2.5 and PM 10), Carbon monoxide (CO), black carbon (BC), Ozone (O3), sulfur dioxide and nitrogen oxides (NOX). All these pollutants including the particulate matter, are often not visible to the naked eye, because the sizes of these pollutants are much smaller than the detection power of human eye……
Clean air, free of all contaminants is the key to maintain good overall health. Cleaner air provides us with many health benefits, like cleaner lung, improved digestion, improved mood, decreased allergies/ asthma, and thus overall, a longer life span. Thus, a basic requirement for human health and well-being is clean air. However, an increase in the various natural events, and human activities, in the recent past, have led to worsening of the ambient air quality.
Air pollution is defined as the contamination of outdoor/indoor air by a wide range of harmful pollutants, which can be in gaseous form, or solids. Among the huge spectrum of air pollutants, there are certain air pollutants, which are regarded as most harmful to health. They include, particulate matter (PM 2.5 and PM 10), Carbon monoxide (CO), black carbon (BC), Ozone (O3), sulfur dioxide and nitrogen oxides (NOX). All these pollutants including the particulate matter, are often not visible to the naked eye, because the sizes of these pollutants are much smaller than the detection power of human eye. But, their invisibility does not guarantee their non-existence in the concurrent environment.
The particulate matter (PM2.5 and PM10) is defined as any solid or liquid substance, that is suspended in the air. Unlike the other major air pollutants, particulate air pollution is defined by the particle size (rather than its chemical composition). The smaller the size of these particulates, the more damage they can cause to our body. PM10 is mainly generated by road dust and construction related activities, like stone processing, stone crushing etc. PM2.5 comes primarily from combustion activities in coal or natural gas fire-plants, fireplaces, care engines etc.
PM10 cause irritation of the airways, especially in the asthmatics and elderly. They also cause drying of the throat, and burning sensation in the eyes. However, a sizeable portion of the PM10 inhaled, is halted in the respiratory tract, thus reducing damage.
PM2.5 are however, small enough to bypass the respiratory system, and thus, very easily get into the lungs, and can even penetrate the blood stream. In long term, continued exposure to PM2.5 can lead to premature heart attacks, depressed lung function, worsening of Asthma, and overall decrease in life expectancy. The risk increases when engaged in physical activity and exercise.
PM2.5 (also called as FINE PARTICULATE MATTER) is the key indicator for measuring air pollution health impacts, and the permissible limits (WHO guidelines) are 10 µg/m3 annual mean, and 25 µg/m3 24-hour mean.
Air pollution has both acute as well as chronic effects on our health, and it affects different systems and organs at the same time. The ill health effects can range from minor upper respiratory tract irritation, to, chronic respiratory diseases, and also, heart diseases, lung cancer, acute respiratory infections in infants and children, and chronic bronchitis in adults. In susceptible individuals, there can be exacerbation of lung diseases, and increase in blood coagulability, which in turn explains the increase in cardiovascular morbidity and mortality.
AIR QUALITY INDEX and associated Health Impacts
In India, the air quality is monitored by the National Air Quality Index (AQI), which was launched by the Ministry of Environment, Forests, and Climate Change, in October 2014. The AQI is a “One Number- One Colour- One Description”, devised for the common man, so that he/she can judge the air quality within their vicinity. For calculating AQI, a sub-index of eight pollutants is calculated, and the worst sub index reflects overall AQI. The eight Pollutants are, namely, PM10, PM2.5, NO2, SO2, CO, O3, NH3 and Pb. These are monitored 24 hourly, except for O3 and CO, which are monitored 8 hourly.
Six colour coded categories have been defined, based on the AQI, and the health impacts also worsen, with worsening of the AQI.
The AQI values are periodically updated (region wise) on various public and private web portals.
Strategies to prevent harmful effects of Air Pollution
Health Education is the key
Numerous public health agencies like World Health Organization, Ministry of Health, have and keep issuing Public Health Advisories, at the time of alarming pollution levels, in order to minimize the impact of those air pollutants. The advisory recommends certain measures to be taken, like: –
• To Remain Indoors, especially during high pollution episodes, and particularly, those more vulnerable (children, older people, pregnant women, pre-existing severe illnesses etc.). It is advised to keep the doors and windows closed, to limit the penetration of pollutants, especially particulate matter, from outside.
• To prevent any additional sources of air pollution in home, by avoiding the usage of certain items in home, like wood burning stoves, candles, incense sticks, tobacco products etc.
• To prefer wet mopping and dusting for cleaning inside home. Avoid sweeping or vacuuming, as they stir up additional dust and particles.
• Certain appliances can help to reduce the levels of indoor air pollution, like
Air purifiers, with carbon and HEPA (High Efficiency Particulate Air) filters.
Electronic air cleaners (e.g. electrostatic precipitator)
Vacuum cleaners with a HEPA filter.
Air conditioners, with an appropriate filter.
• To limit driving motorized vehicles, and promote the use of public transportation and ride sharing. This helps by preventing worsening of the already high levels of pollution.
• Plan outdoor activity during the middle of the day, when the particulate levels have been seen to be considerably lower, compared to the morning and evening hours.
• Use respiratory masks for protection, when outdoors for long time periods. The recommended masks are N95, and more sensitive persons can use N99 version of masks. Scarves, face masks, bandanas etc. are of no use, as they do not filter the airborne particulate matter.
The Air Quality Index (AQI) has been developed by the Environmental Protection Agency (EPA) to provide accurate, timely, and easily understandable information about daily levels of air pollution. The Index provides EPA with a uniform system of measuring pollution levels for the major air pollutants regulated under the Clean Air Act. Once these levels are measured, the AQI figures are reported in all metropolitan areas of the United States with populations exceeding 200,000.
Index figures enable the public to determine whether air pollution levels in a particular location are Good, Moderate, Unhealthy for Sensitive Groups or worse. In addition, EPA and local officials use the AQI as a public information tool to advise the public about the general health effects associated with different pollution levels and to describe whatever precautionary steps may need to be taken if air pollution levels rise into the unhealthy range.
The EPA uses the Air Quality Index to measure five major pollutants for which it has established National Ambient Air Quality Standards under the Clean Air Act. The pollutants are sulfur dioxide, carbon monoxide, nitrogen dioxide and ozone. (Note: Ozone at the ground level can be a health and environment problem, but ozone is beneficial in the stratosphere (6-30 miles above the Earth) where it shields the Earth from the sun’s harmful ultraviolet radiation. EPA has programs to reduce chlorofluorocarbons and related substances to protect the stratospheric ozone layer. The AQI relates only to ground-level ozone, a major component of smog.)
For each of the five pollutants, EPA has established air quality standards protecting against health effects that can occur within short periods of time (a few hours or a day). For example, the standard for sulfur dioxide – that is, the allowable concentration of this pollutant in a community’s air – is 0.14 parts per million measured over a 24-hour period. Air concentrations higher than 0.14 parts per million (ppm) exceed the national standard. For ozone, the 8-hour average concentration permitted under the standard is 0.085 parts per million (ppm).
The AQI converts the measured pollutant concentration in a community’s air to a number on a scale of 0 to 500. The most important number on this scale is 100, since that number corresponds to the standard established under the Clean Air Act. A 0.14 ppm reading for sulfur dioxide or a 0.085 ppm reading for ozone would translaate to an AQI level of 100. An AQI level in excess of 100 means that a pollutant is in the Unhealthy for Sensitive Groups range or worse on a given day; an AQI level at or below 100 means that a pollutant reading is in the satisfactory range.
The intervals and the terms describing the AQI air quality levels are as follows:
From 0 to 50………………..good
From 51 to 100……….moderate
From 101 to 150……………..unhealthy for sensitive groups
From 151 to 200……..unhealthy
From 201 to 300…very unhealthy
From 300……………….hazardous
The intervals on the AQI scale relate to the potential health effects of the daily concentrations of each of these five pollutants. Each value has built into it a margin of safety that, based on current knowledge, protects highly susceptible members of the public.
EPA determines the index number on a daily basis for each of the five pollutants; it then reports the highest of the five figures for each major metropolitan area, and identifies which pollutant corresponds to the figure that is reported. For example, if EPA reports an AQI level of 90 for ozone for a given metropolitan area, residents of the area would know that the ozone level for the region is at the high end of the moderate range; they would also know that ozone is the pollutant with the highest AQI reading for the day, and that all other pollutants are therefore in the good or moderate range. On days when two or more pollutants exceed the standard (that is, have AQI values greater than 100), the pollutant with the highest index level is reported, but information on any other pollutants above 100 may also be reported.
Levels above 100 may trigger preventive action by State or local officials, depending upon the level of the pollution concentration. This could include health advisories for citizens or susceptible individuals to limit certain activities and potential restrictions on industrial activities. The 200 level is likely to trigger an “Alert” stage. Activities that might be restricted by local governments, depending upon the nature of the problem, include incinerator use, and open burning of leaves or refuse. A level of 300 on the AQI will probably trigger a “Warning,” which is likely to prohibit the use of incinerators, severely curtail power plant operations, cut back operations at specified manufacturing facilities, and require the public to limit driving by using car pools and public transporation. A AQI level of 400 or above would constitute an “Emergency,” and would require a cessation of most industrial and commercial activity, plus a prohibition of almost all private use of motor vehicles. If air pollution were to reach such extremely high levels, death could occur in some sick and elderly people, and even healthy people would likely experience symptoms that would necessitate restrictions on normal activity. Before determining which stage is to be called, officials examine both current pollutant concentrations and prevailing and predicted meteorological conditions.
The table above identifies health effects associated with different levels of air pollution, along with the cautionary statments that would be appropriate if air pollution in a community were to fall into one of the “unhealthful” categories on the AQI scale.
In most communities in the United States, AQI levels generally fall between zero and 100; readings in excess of 100 are likely to occur only a few times a year, if at all. Only 1.4% of all readings in the U.S. exceeded 100 during calendar years 1990 and 1991. Several metropolitan areas in the U. S. have more severe air pollution problems, and may often experience AQI levels in excess of 100. However, even in these areas, AQI readings in excess of 200 are quite rare. During calendar years 1990 and 1991, for example, just one-tenth of one percent of the AQI readings exceeded 200, and only 0.003 of one percent exceeded 300. (Urban areas outside the U. S. with dense population centers and large numbers of uncontrolled pollution sources frequently report AQI levels in excess of 250.)
Significant seasonal variations can occur in AQI-reported values. In winter, carbon monoxide is likely to be the pollutant with the highest AQI levels, because cold weather makes it much more difficult for automotive emission control systems to operate effectively. In summer, the chief pollutant in many communities is likely to be ozone, since emissions of volatile organic compounds and nitrogen oxides form ozone much more rapidly in the presence of heat and sunlight.
The AQI places maximum emphasis on acute health effects occurring over very short time periods – 24 hours or less – rather than chronic effects occurring over months or years. By notifying the public when an AQI value exceeds 100, citizens are given an adequate opportunity to react and take whatever steps they can to avoid exposure. The approach EPA follows is conservative, because (1) each standard has built into it a margin of safety that is designed to protect highly susceptible people, and (2) the public notice is triggered as soon as a single sampling station in the community records an AQI level that exceeds 100.
Use of the AQI allows for flexible reporting. A typical television or radio announcement might read: “The pollution index reported at noon today is 150, and the air is considered unhealthful. The pollutant causing this problem is ozone, which, along with other components of smog, can cause eye, nose and throaat irritation, as well as chest pain. We expect the concentration of ozone to diminish this afternoon. People with respiratory ailments and heart disease should reduce physical exertion and outdoor activity at this time. The forecast for tomorrow calls for no change in the index.”
A more detailed account could be provided by recorded telephone reports or newspapers. For example, listeners can be informed that ozone normally peaks in he afternoon so that later AQI reports will show the index declining, unless there is a significant episode taking place that would cause ozone to continue to build throughout the day. Likewise, if carbon monoxide is the pollutant of concern, the AQI report could add that carbon monoxide is usually only a problem during morning or evening rush hours with acceptable air quality expected during the rest of the day.
What the AQI Cannot Do
Although it is uniform across the country, the AQI cannot be used as the sole method for ranking the relataive healthfulness of different cities – a variety of factors in addition to AQI levels would have to be considered. For example, the number of people actually exposed to air pollution, transportation patterns, industrial composition, and the representativeness of the monitoring sites would also need to be taken into account in developing an accruate ranking of metropolitan areas.
Moreover, the AQI does not specifically take into account the damage air pollutants can do to animals, vegetation, and certain materials, like building surfaces and statues. There is, however, likely to be a correlation between increased AQI levels and increased damage to the overall environment,and a local regulatory agency might choose to point out the impact that an elevated AQI value is likely to have on agriculture and property in the region.
Finally, the AQI does not take into account the possible adverse effects associated with combinations of pollutants (synergism). As more research is completed in the future, the AQI may be modified by EPA to include such effects.
Condensed from Measuring Air Quality: The Pollutant Standards Index; Office of Air Quality Planning and Standards, US EPA; EPA 451/K-94-001; February 1994.
(The authors are from Department of Community Medicine, Maulana Azad Medical College, New Delhi)