
NFHS-4: Towards a Healthier India
The National Family Health Survey-4, conducted during 2015-16, has shown encouraging outcomes of concerted efforts and focussed interventions in the health sector in India. For instance, Infant Mortality Rate substantially declined over the period from 79 per 1,000 live births in NFHS-1 (1992-93) to 41 per 1,000 live births in NFHS-4; fewer children under five years of age are now found to be stunted and underweight, showing intake of improved nutrition, and households are now more inclined to use improved water and sanitation facilities. Read on for detailed findings of the survey…
By Abhigyan
The first phase of the National Family Health Survey (NFHS-4), 2015-16 in 15 States/Union Territories reveals that fewer children are dying in infancy and early childhood, while after the last round of survey in 2005-06, infant mortality has declined.
All 15 states/Union Territories have rates below 51 deaths per 1,000 live births, although there is considerable variation among the states/Union Territories. Infant mortality rates range from a low of 10 in Andaman and Nicobar Islands to a high of 51 deaths per 1000 live births in Madhya Pradesh. Better care for women during pregnancy and childbirth contributes to reduction of maternal deaths and improved child survival.
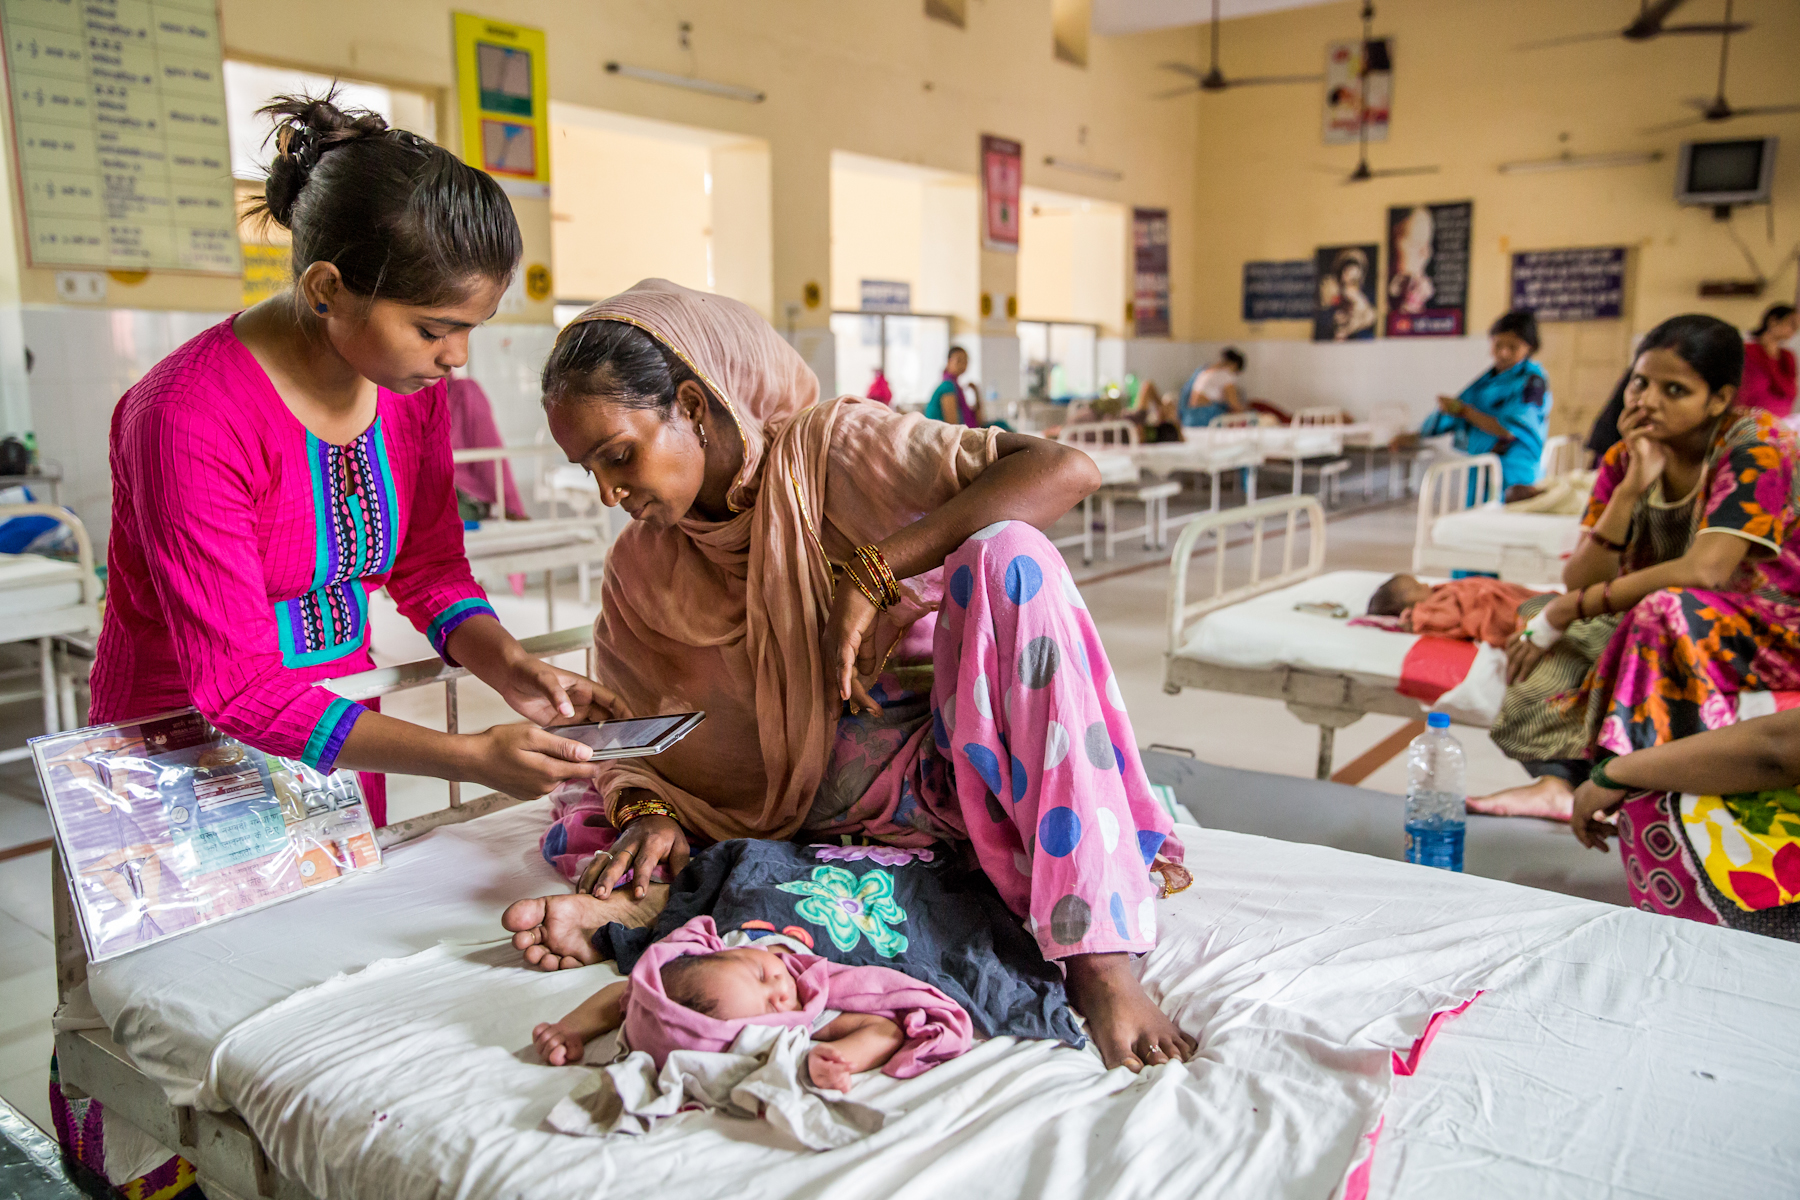
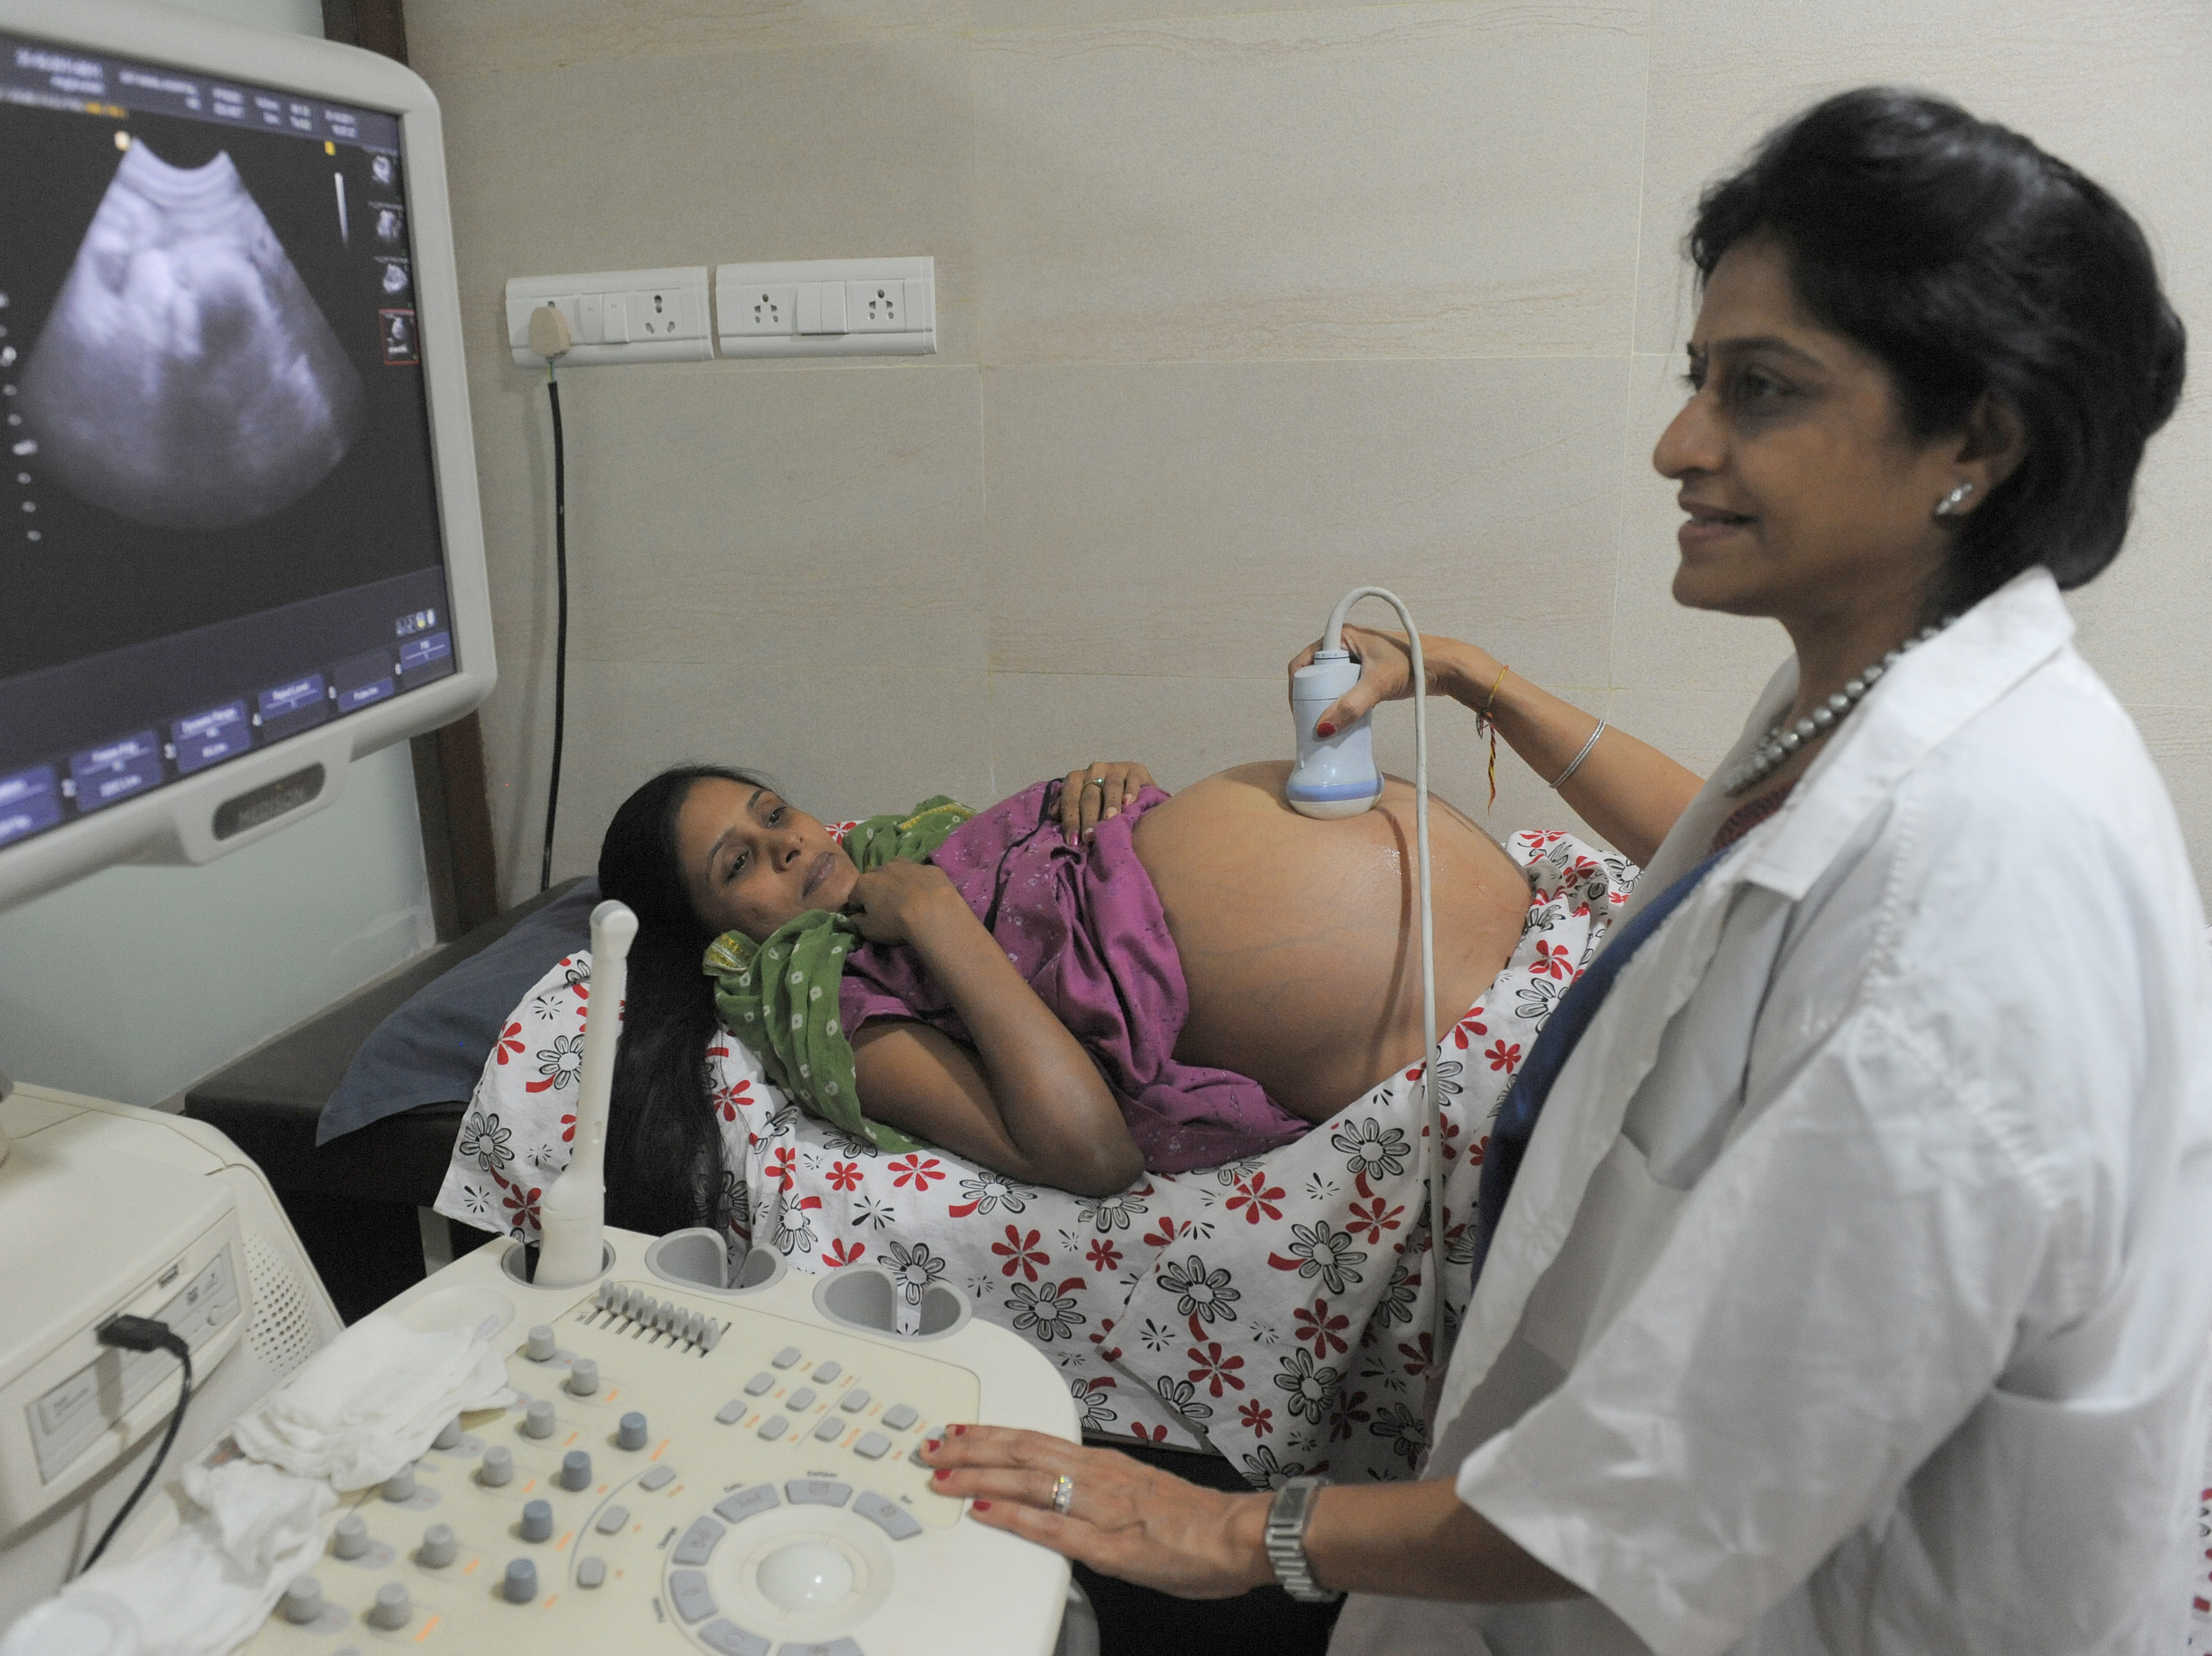
Almost all mothers have received antenatal care for their most recent pregnancy and increasing numbers of women are receiving the recommended four or more visits by the service providers. More and more women now give birth in health care facilities and rates have more than doubled in some states in the last decade. More than nine in ten recent births took place in health care facilities in Andaman and Nicobar Islands, Andhra Pradesh, Goa, Karnataka, Puducherry, Sikkim, Tamil Nadu, and Telangana, providing safer environments for mothers and new-borns.
Overall, women in the First Phase states/Union Territories are having fewer children. The total fertility rates, or the average number of children per woman, range from 1.2 in Sikkim to 3.4 in Bihar. All First Phase states/Union Territories except Bihar, Madhya Pradesh and Meghalaya have either achieved or maintained replacement level of fertility – a major achievement in the past decade.
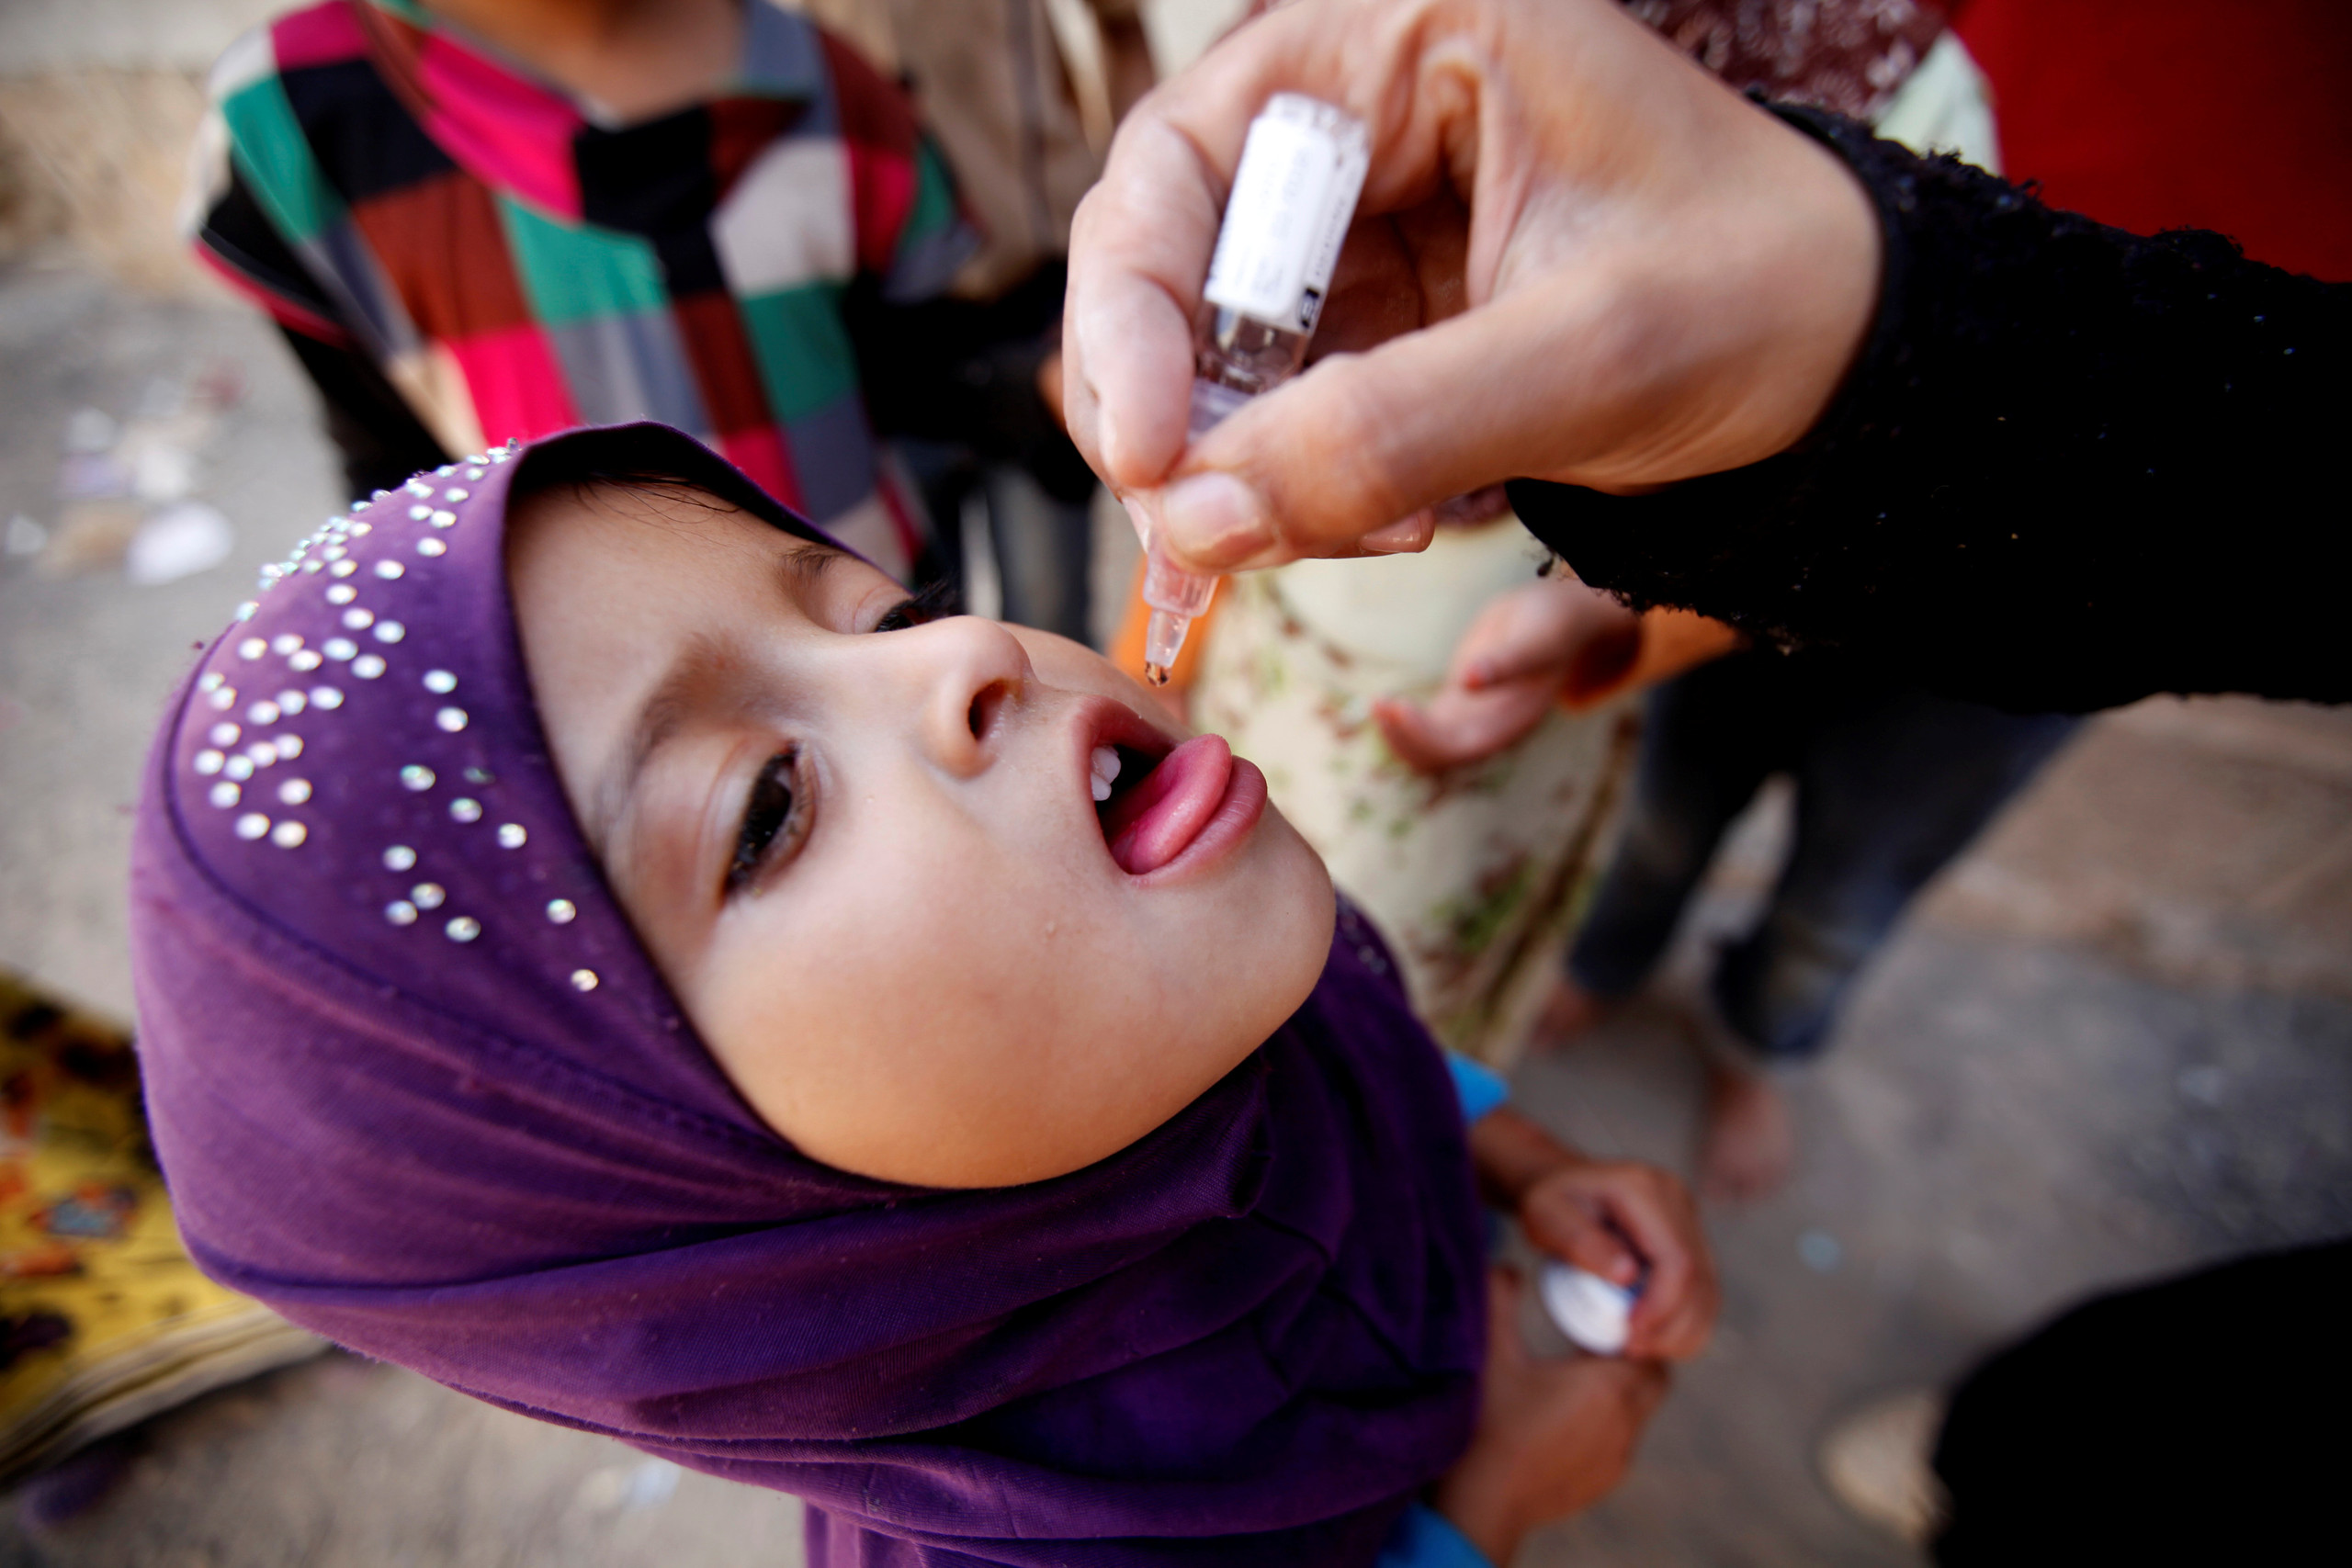
Full immunization coverage among children age 12-23 months varies widely in the First Phase states/Union Territories. At least 6 out of 10 children have received full immunization in 12 of the 15 states/Union Territories. In Goa, West Bengal, Sikkim, and Puducherry more than four-fifths of the children have been fully immunised. Since the last round of National Family Health Survey, the coverage of full immunization among children has increased substantially in the states of Bihar, Madhya Pradesh, Goa, Sikkim, West Bengal and Meghalaya.
Married women are less likely to be using modern family planning in eight of the First Phase states/Union Territories. There has been any increase in the use of modern family planning methods only in the states of Meghalaya, Haryana, and West Bengal. The decline is highest in Goa followed by Karnataka and Tamil Nadu. Despite the decline, about half or more married women are using modern family planning in eight of the 15 states/Union Territories.
Poor nutrition is less common than reported in the last round of National Family Health Survey. Fewer children under five years of age are now found to be stunted, showing intake of improved nutrition. In nine states/Union Territories, less than one-third of children are found too short for their age. While this reveals a distinct improvement since the previous survey, it is found that in Bihar, Madhya Pradesh and Meghalaya more than 40% of children are stunted.
Wasting is still very high by international standards in all of the states/Union Territories. Anaemia has also declined, but still remains widespread. More than half of children are anaemic in ten of the 15 states/Union Territories. Similarly, more than half of women are anaemic in eleven states/Union Territories. Over-nutrition continues to be a health issue for adults. At least 3 in 10 women are overweight or obese in Andaman and Nicobar Islands, Andhra Pradesh, Goa, Puducherry, and Tamil Nadu.
Indian families in the First Phase households are now more inclined to use improved water and sanitation facilities. Over two-thirds of households in every state/Union Territory have access to an improved source of drinking water, and more than 90% of households have access to an improved source of drinking water in nine of the 15 states/Union Territories. More than 50% of households have access to improved sanitation facilities in all First Phase states/Union Territories except Bihar and Madhya Pradesh. Use of clean cooking fuel, which reduces the risk of respiratory illness and pollution, varies widely among the First Phase states/Union Territories, ranging from only about 18% of households in Bihar to more than 70% of households in Tamil Nadu and more than 80% of households in Puducherry and Goa. The success of the first National Family Health Survey, conducted in 1992-93, in creating an important demographic and health database in India has paved the way for repeating the survey.
The second National Family Health Survey (NFHS-2), undertaken in 1998-99, is designed to strengthen the database further and facilitate implementation and monitoring of population and health programmes in the country. As in the earlier survey, the principal objective of NFHS-2 is to provide state and national estimates of fertility, the practice of family planning, infant and child mortality, maternal and child health, and the utilization of health services provided to mothers and children. In addition, the survey provides indicators of the quality of health and family welfare services, women’s reproductive health problems, and domestic violence, and includes information on the status of women, education, and the standard of living.
Another feature of NFHS-2 is measurement of the nutritional status of women. Height and weight measurements, which were available only for young children in the earlier survey, were extended to cover all eligible women in NFHS-2. In addition, ever-married women and their children below age three had their blood tested for the level of haemoglobin, using the Hemo Cue instrument. Through these blood tests, for the first time the survey provides information on the prevalence of anaemia throughout India. In two metropolitan cities, Delhi and Mumbai, a further test was done for children below age three to measure the lead content in their blood. The survey also measured the extent to which households in India use cooking salt that has been fortified with iodine.
The NFHS-2 survey covered a representative sample of more than 90,000 eligible women age 15-49 from 26 states that comprise more than 99 percent of India’s population. The data collection was carried out in two phases, starting in November 1998 and March 1999. The survey provides state-level estimates of demographic and health parameters as well as data on various socioeconomic and programmatic factors that are critical for bringing about desired changes in India’s demographic and health situation.
The survey provides urban and rural estimates for most states, regional estimates for four states (Bihar, Madhya Pradesh, Rajasthan, and Uttar Pradesh), separate estimates for three metro cities (Chennai, Kolkata, and Mumbai), and estimates for slum areas in Mumbai. The survey used uniform questionnaires, sample designs, and field procedures to facilitate comparability of the data and to achieve a high level of data quality. Preliminary reports with selected results were prepared earlier for each state and presented to policymakers and 12th programme administrators responsible for improving health and family welfare programmes in most states.
BOX:
Obesity: Forerunner of metabolic dysfunction
According to a recent report of National Family Health Survey (NFHS) 2015-16, the high rates of obesity in general, and in some states/UTs in particular, create concern for future metabolic health. Obesity is the forerunner of metabolic dysfunction and predisposes to illnesses like diabetes and hypertension.
The NFHS reveals interesting data regarding the prevalence of metabolic syndrome in India. Perhaps the largest exercise of its kind in the world, NFHS assesses the health status of our nation. Traditionally, NFHS has focused on family planning, maternal and child health, nutritional makers of health, and communicable disease risk factors. In keeping with recent changes in morbidity patterns,
NFHS has now begun to monitor metabolic health as well. This approach is welcome, as it helps assess the prevalence of various no communicable diseases in India. NFHS uses robust methods to collate data regarding the health of the country and ensures accuracy by comprehensive, well-documented training of field staff.
The previous survey has recently reported findings from 15 Indian states and union territories (UT). The data related to metabolic health makes interesting reading. As part of its data collection exercise, NFHS has measured body mass index (BMI), random blood glucose (RBG), and blood pressure in adults. BMI is greater than 18.5 and less than 25.0 kg/m 2, for men and women, as well as urban and rural inhabitants separately. Gender-specific prevalence of adults with high blood sugar (greater than 140 mg percent) and very high blood sugar (greater than160 mg percent) is given. Similarly, the prevalence of high blood pressure has been classified as mild, moderate, and severe, based on systolic and/or diastolic blood pressure.
The prevalence of obesity (BMI greater than 25 kg/m 2) varies from state to state, with Andaman and Nicobar Islands (AN) men and Puducherry women being the heaviest (38.2% and 36.7%), respectively. The heaviest states for men, after AN, are Puducherry (37.1%), Sikkim (34.8%), Andhra Pradesh (AP) (33.5%), and Goa (32.6%).Puducherry women are followed by Goa (33.5%) AP (33.2%), AN (31.8%), and Tamil Nadu (TN) (30.9%) as far as the prevalence of obesity is concerned. The least prevalence of male obesity is found in Meghalaya (10.1%), Madhya Pradesh (MP) (10.9%), Bihar (12.6%), West Bengal (WB) (14.2%), and Tripura (15.9%). The lowest percentage of obese women is reported from Bihar (11.7%), Meghalaya (12.2%), MP (13.6%), and Tripura (16.0%). The high rates of obesity in general, and in some states/UTs in particular, create concern for future metabolic health.
What is National Family Health Survey?
The National Family Health Survey is a large-scale, multi-round survey conducted in a representative sample of households throughout India. Three rounds of the survey have been conducted since the first survey in 1992-93.
The Ministry of Health and Family Welfare (MOHFW), Government of India, designated the International Institute for Population Sciences (IIPS), Mumbai, as the nodal agency, responsible for providing coordination and technical guidance for the survey. IIPS collaborated with a number of Field Organizations (FO) for survey implementation. Each FO was responsible for conducting survey activities in one or more states covered by the NFHS.
Universal increases in mean marriage age
In a context of rising marriage age for women and a compression of first birth intervals, the National Health Family Survey’s study uses survival analysis, hazard models, and multivariate decomposition techniques to investigate the influence of marriage age on the first birth interval over time, and the implications of both marriage age and first birth interval on the second birth interval. Secondarily, the study assesses the influence of the gender context.
Marriage age has steadily risen for women in much of South and Southeast Asia, although different regions experience variation in average ages at marriage and rates of increase. A relationship between nuptiality patterns and certain fertility dynamics, specifically the initiation of childbearing and total fertility, is well established and there is an expected shortening of the first birth interval that coincides with later marriage. However, there is variation across countries in the first birth interval and its rate of change even when average marriage age is similar. Less known is whether marriage age or other factors exert more influence on the first birth interval, whether trends in marriage age and the first birth interval are universal or localized among selected subgroups of women, and to what extent compositional shifts contribute to changes in the first birth interval and the relative importance of marriage age to birth spacing beyond the first birth interval.
This study uses survival analysis, hazard models, and multivariate decomposition techniques to investigate the influence of marriage age on the first birth interval over time, and the implications of both marriage age and first birth interval for the second birth interval. In addition, attention is given to indicators that describe the gender context. The study analyzes these relationships in seven countries, four in South Asia and three in Southeast Asia that have experienced significant change in either age at marriage or the first birth interval, or both.
Demographic and Health Surveys data from over approximately a decade are used to examine changes in these dynamics over time. Significant increases in marriage age and significant decreases in the first birth interval (except in Cambodia) are observed, albeit at varying rates. Later marriage is associated with shorter first birth intervals but longer second birth intervals. Marriage age remains the most consistent influence on the first birth interval after controlling for birth cohort, gender context, and women’s and husbands’ characteristics. Compositional shifts toward later marriage contributes substantially (38%-89%) to declines in the first birth interval in Bangladesh, India, Nepal, Pakistan, Indonesia, and the Philippines, while a change in the effect of marrying later contributes to change in the first birth interval in India and Nepal. Marriage age continues to influence the second birth interval, after controlling for the length of the first birth interval and other covariates.
The study addresses these relationships in seven countries, four in South Asia and three in Southeast Asia which have experienced significant change in age at marriage, the first birth interval, or both in recent decades. Data from Demographic and Health Surveys are used from two points in time over approximately a 10-year period to examine changes in these dynamics over time. This study identified two distinct marriage patterns based on region: median completed age at marriage is low (during adolescent years) in South Asia and older in Southeast Asia. Similarly, the median completed age at first birth is lower and the difference between median age at first birth and marriage is longer in South Asia than in Southeast Asia. However, time trends are not contrasted consistently between the two regions, nor are they consistent with region. Instead, the pace of change has been variable. Marriage age has increased rapidly in Indonesia, Nepal, and Bangladesh, but has been slower elsewhere.
The difference between the median completed age at marriage and first birth has remained steady in Pakistan, Cambodia, and the Philippines, but narrowed elsewhere. The mean marriage age has increased significantly in all study countries. With this increase, the first birth interval has become significantly shorter in four countries: Bangladesh, Nepal, Pakistan, and Indonesia. The decrease has been smaller in Pakistan and Indonesia. Meanwhile, the first birth interval has lengthened significantly in India and the Philippines while there has been no change in Cambodia. This study examines trends in marriage age across a range of indicators that describe the gender context, women’s socio-economic and socio-cultural milieu, and husband’s characteristics.
The study found universal increases in mean marriage age in South Asia (and Indonesia), across nearly all categories or levels of these indicators. However, marriage age increased at differential rates among groups in these countries. Increases in marriage age are localized in Southeast Asia within groups where marriage age was already higher, which means that differentials in marriage age grew wider by most characteristics in most countries. Trends in Indonesia, both in marriage age overall and across subgroups of women, more closely resemble those observed in South Asia than in either Cambodia or the Philippines. The two countries where the first birth interval increased rather than decreased over time (the Philippines and India) manifest slightly different driving factors.
In India, the contributions to a shorter first birth interval of more women marrying at older ages are amplified by a shorter first birth interval at all ages of marriage. However, the effect of these shifts in both composition and rate is reversed by cumulative changes in rates. Women in selected occupations, with secondary and higher education, and Hindu women, among others, experience longer first birth intervals than in the past, and this results in slightly longer first birth intervals overall.
In the Philippines, contributions to shorter first birth intervals of more women marrying at older ages than in the past are reversed by cumulative changes in rates over time for certain subgroups. Most notably, the first birth interval has become longer among Roman Catholics (contributing 345% to the change in the first birth interval), women with any education, women in the National Capital and two other regions, women who do not work, and those with husbands in professional occupations.
As with the first birth interval, marriage age is strongly significantly associated with the second birth interval, but the size of the effect is modest effect. Marriage age is associated with a 1.3-3.5% longer second birth interval in all seven countries. The effect is attenuated slightly when controls are added except in Pakistan, where the association is not significant. The result leads to the conclusion that marriage age influences not just the timing of the first birth, but also birth spacing, even after controlling for changes in birth cohort, the duration of the first birth interval, and other covariates.
The duration of the first birth interval is positively associated with second birth interval, except in Nepal. This influence is particularly strong for women with first birth intervals in the longest tercile. These women experience second birth intervals that are 5-20% longer than women whose first birth intervals fall in the shortest tercile. Similarly, women who were born in later birth cohorts experience longer second birth intervals than do women born 1960-69 in all countries except India and Pakistan.
In contrast, indicators that describe the gender context are poorly and inconsistently associated with longer second birth intervals, after marriage age, birth cohort, first birth interval, and other covariates are controlled. This finding would suggest that, to the extent that gender context influences birth spacing, it does so largely indirectly through these other factors. Husband’s characteristics and women’s place of residence are also inconsistently associated with the second birth interval. However, several socio-economic and socio-cultural indicators (education, wealth, and occasionally subnational region and religion) tend to be independently associated with the second birth interval, independent of other factors.
Box:2
National Family Health Survey-4 (Survey Period- 2015-16)
Information collected from
6 lakh households, 7 lakh women and 1.3 lakh men for the first time provide district level estimates
The results by and large reflect that concerted efforts and focussed interventions in the health sector are translating to improved outcomes.
NFHS-3 was conducted during 2005-06.
Key highlights:
1.Infant mortality rate (IMR)
• IMR declined from 57 to 41 per 1,000 live births between NFHS-3 and NFHS-4.
• IMR has declined substantially in almost all the states during the last decade.
• In Tripura, West Bengal, Jharkhand, Arunachal Pradesh, Rajasthan and Odisha: dropped by more than 20 percentage points.
• Infant mortality substantially declined over the period from 79 per 1,000 live births in NFHS-1 (1992-93) to 41 per 1,000 live births in NFHS-4.
2. Institutional births
• Dramatically increased by 40 percentage points from 38.7 percent in NFHS-3 to 78.9 percent in NFHS-4.
• Increase of 34.1 per cent institutional births in public facility.
• Each of the Empowered Action Group (EAG) states and Assam have experienced more than a 40 percentage point increase.
• Targeted approach through Janani SurakshaYojana (JSY) has paid off.
3. Mothers who had at least 4 ANC visits
• The proportion of women who received at least 4 antenatal care visits for their last birth has increased by 14 percentage points from 37 percent to 51.2 percent over the decade (2005-15).
• Substantial increase of 20 or more percentage points in 7 states.
West Bengal (38 percentage points),
Chhattisgarh (31 percentage points),
Himachal Pradesh and Odisha(25 percentage points each),
Assam (23 percentage points),
Jammu & Kashmir (21 percentage points) and
Gujarat (20 percentage points)
4. Total Fertility Rate (TFR)
• TFR declined to 2.2 children per woman from 2.7 in NFHS-3 moving closer to replacement level of 2.1.
• Considerable decline in the TFR in each of the 30 states in India.
Maximum decline observed in
• Uttar Pradesh (1.1 child)
• followed by Nagaland (1.0 child)
• Arunachal Pradesh and Sikkim (0.9 child each)
• Rajasthan, Madhya Pradesh and Meghalaya (0.8 child each)
Decline of TFR
• by 0.5 children per woman between NFHS-1 (1992-93) and NFHS-2 (1998-99),
• by 0.2 children per woman from NFHS-2 (1998-99) to NFHS-3 (2005-06);
•by 0.5 children per woman between NFHS-3 and NFHS-4.
Overall, the level declined by 1.2 children per woman from NFHS-1 to NFHS-4.
5. Children age 12-23 months fully immunized (BCG, measles and 3 doses each of polio and DPT)
•Increased by 18 percentage points from 44 percent in NFHS-3 to 62 percent in NFHS-4.
•full immunization coverage increased in
Punjab, Bihar and Meghalaya (29 percentage point each),
Rajasthan, Uttar Pradesh, Jharkhand and Chhattisgarh (28 percentage points each),
Odisha (27 percentage points) and
West Bengal (20 percentage points).
6.Children age 12-23 months who received most of vaccinations
• Fully immunised: up by 18.5%
• Received BCG: up by 13.7%
• Received 3 doses of DPT: up by 23.1%
• Received measles vaccines: up by 22.3%
• Vitamin A dose: up by 43.7 %
7.Sex ratio at birth (females per 1,000 males)
•Improved from 914 to 919 at the national level over the last decade.
Highest in Kerala (1,047),
Followed by Meghalaya (1,009)
Chhattisgarh (977)
8.Children under 5 years who are stunted and underweight
•Decline in percentage of stunted children: 10 percentage points
•Decline in percentage of underweight children:7 percentage points
•This is a consequence of improved child feeding practices and focus on nutritional aspects of children.
9.Substantial decline prevalence of anaemia among children age 6-59 months
•Declined from 69 per cent in NFHS-3 to 58 per cent in NFHS-4.
maximum decrease in Assam (34 percentage points),
Chhattisgarh (30 percentage points)
Mizoram (26 percentage points)
Odisha (20 percentage points)
10.Children under age 3 years breastfed within one hour of birth
•Substantial increase of 19 percentage points between NFHS-3 and NFHS-4
11.Family Planning Methods
•Unmet needs for Family Planning has shown a decline pointing towards increased outreach of family planning methods.
•Contraceptive prevalence rate among currently married women increased
by 7 percentage points from NFHS-1 (41 percent) to NFHS-2 (48 per cent)
By 8 percentage points from NFHS-2 to NFHS-3 (56 percent).
However, the contraceptive prevalence rate decreased by 2 percentage points from NFHS-3 to NFHS-4 (54 percent) but pill and condom usage have shown increasing trend.